Salesforce Lighting Using Reports Template
Customize this training to give your revenue team the help they need creating reports directly in Salesforce Lighting – or any tool they’re working in.
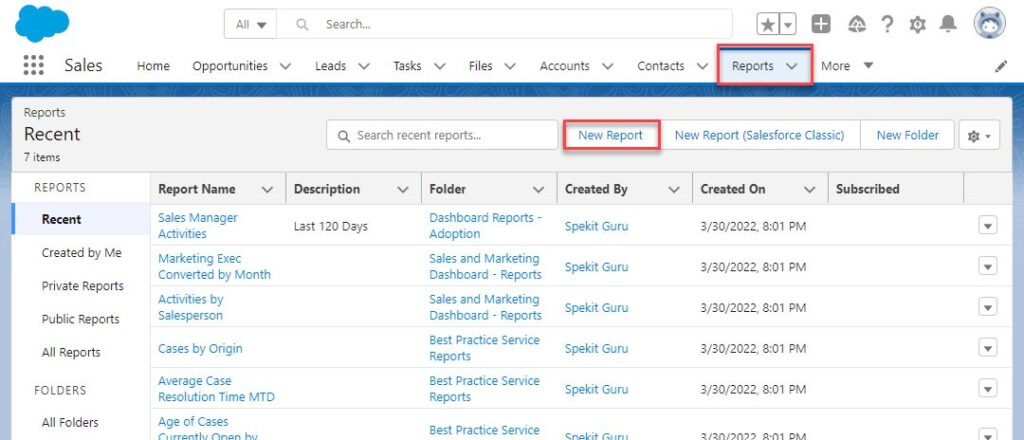
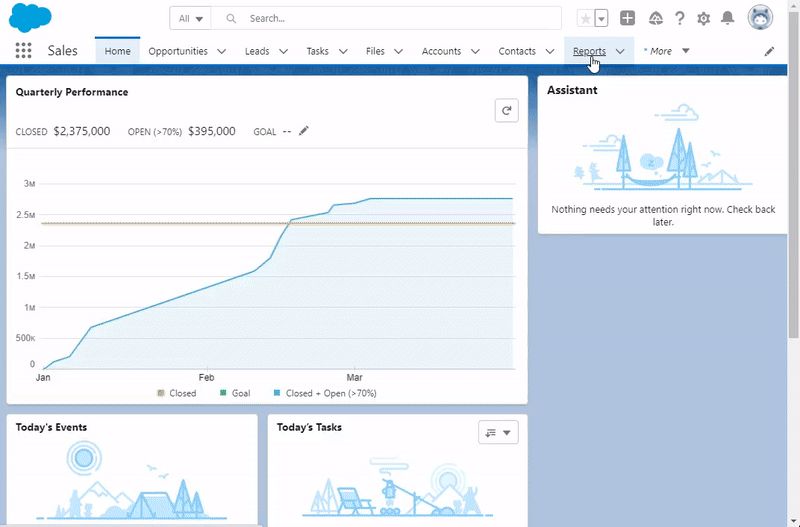
1. How to Create a Report in Salesforce Lightning
- Click the Reports tab.
- Click New Report.
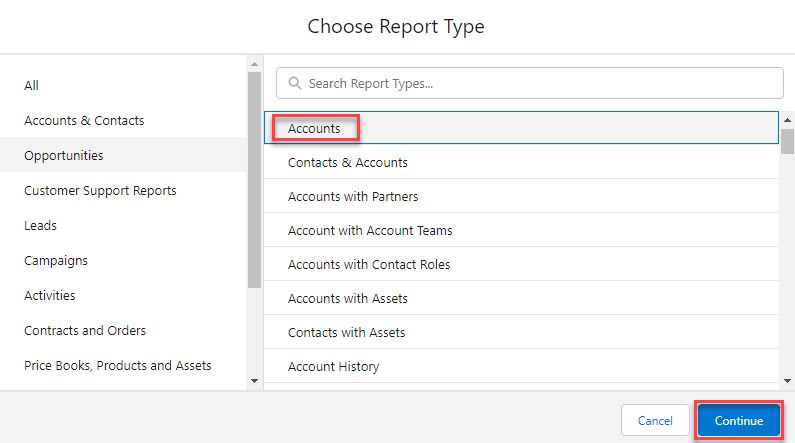
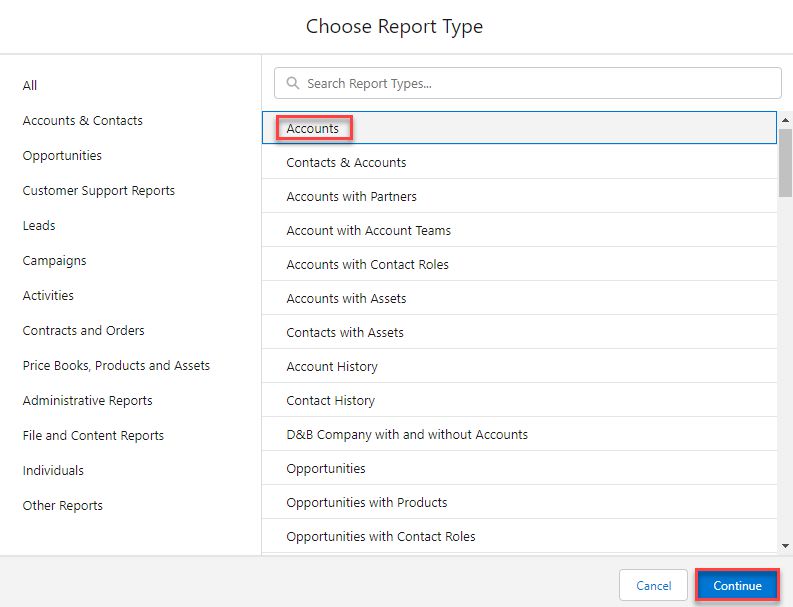
- Choose Report Type.
- Search for “Report Types” to learn more.
- Click Continue.
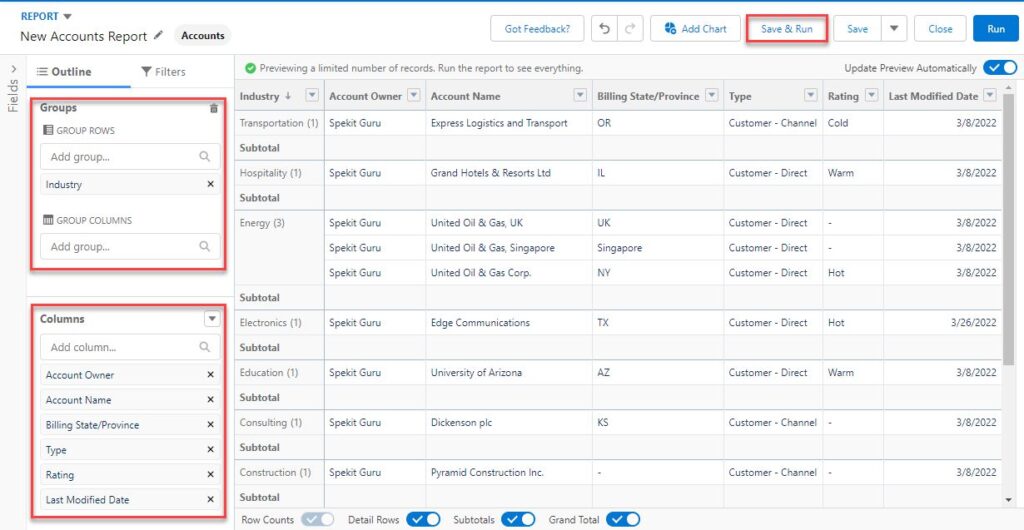
- Outline Tab
- Filter Tab
- Search 🔍 for “Report Filters” to learn more about enhancing reporting capabilities.
- Click Save & Run.
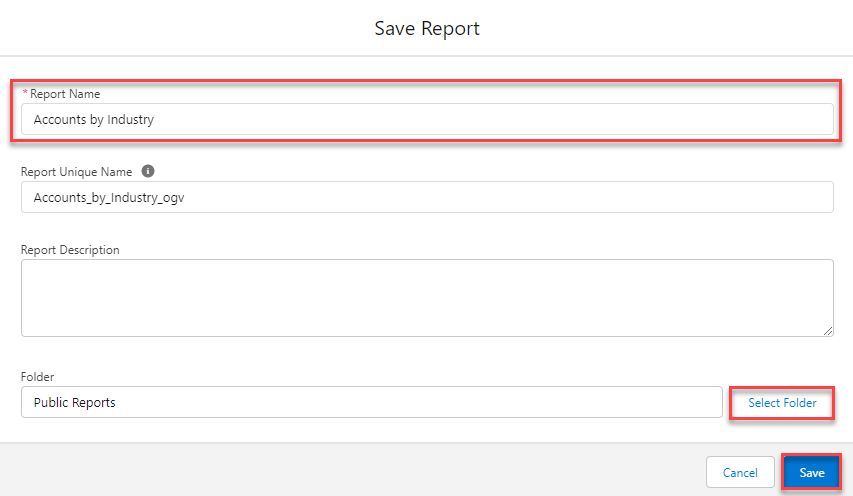
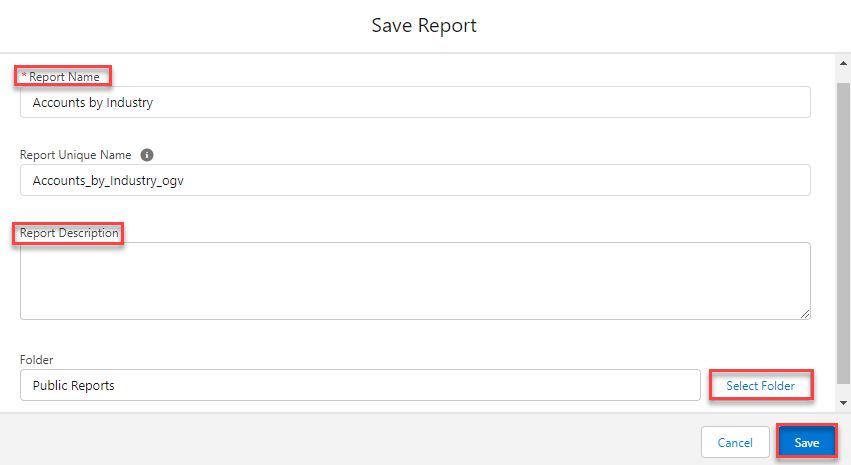
- Enter a Report Name.
- Click Select Folder and choose what folder the report should be saved to.
- Click Save.
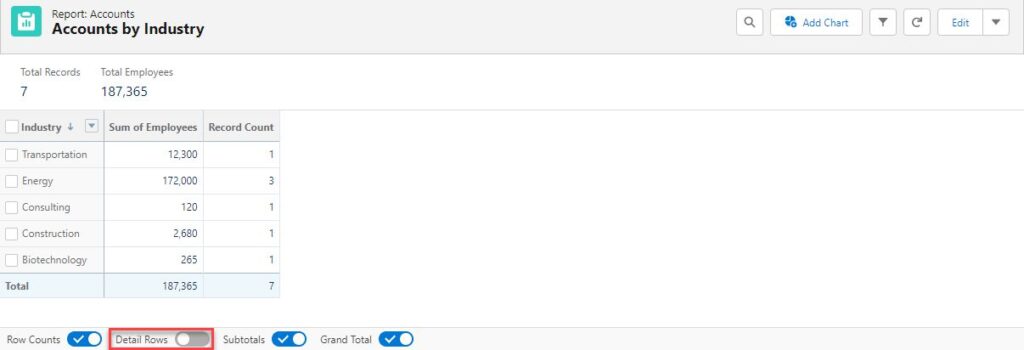
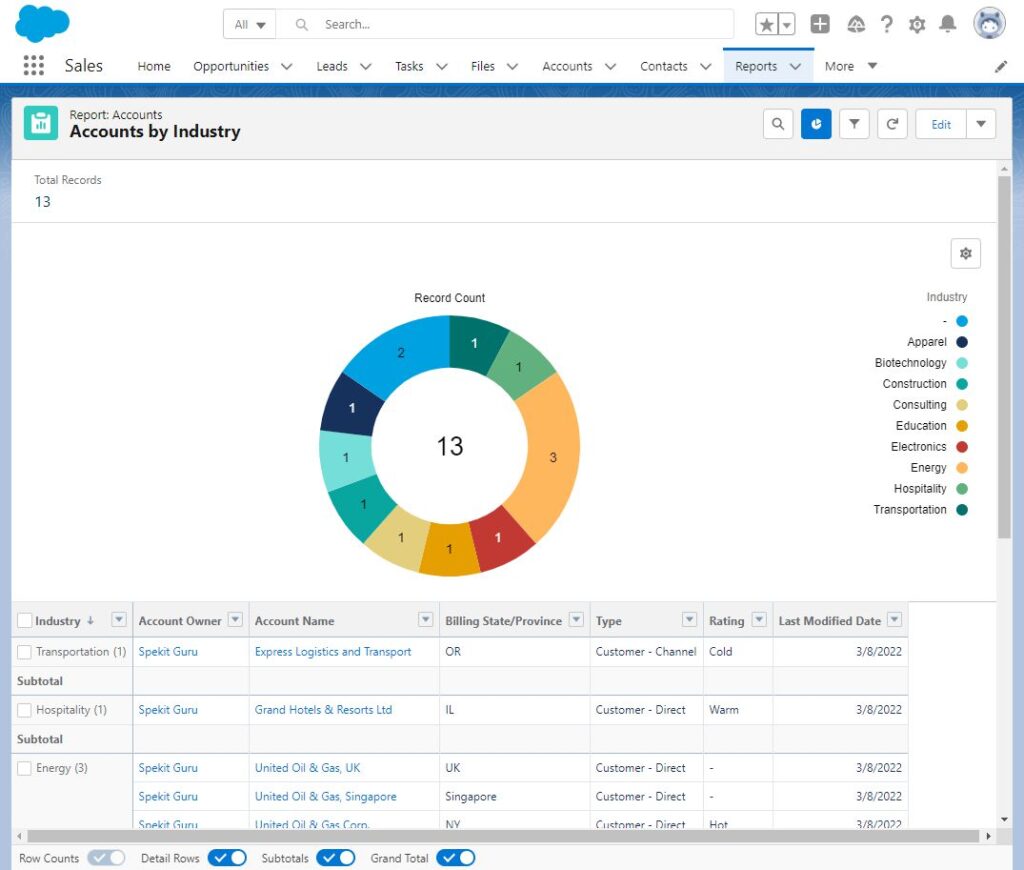
11. Toggles
- Row Counts
- Subtotals
- Grand Total
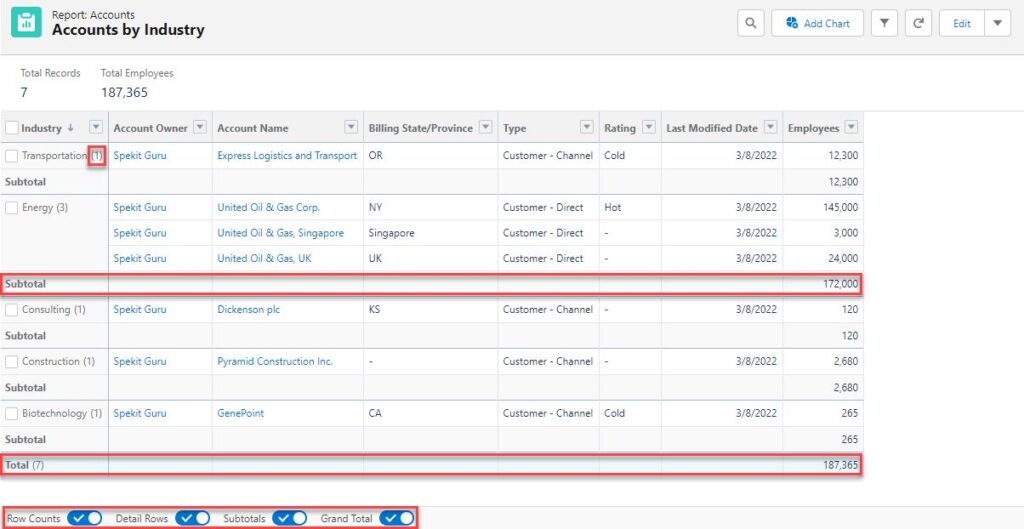
- Detail Rows
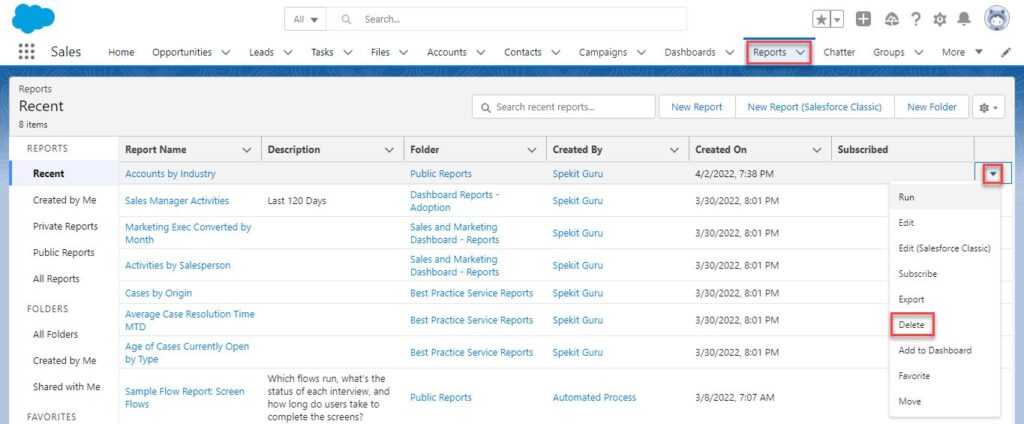
2. How to Delete a Report in Salesforce Lightning
Reminder that this deletes the report for all users and not just you.
1. Click the Reports tab.
2. Find the Report you want to delete.
3. Click the Down Arrow.
4. Click Delete.
-OR-
1. Navigate to the Report.
2. Click the Down Arrow.
3. Click Delete.
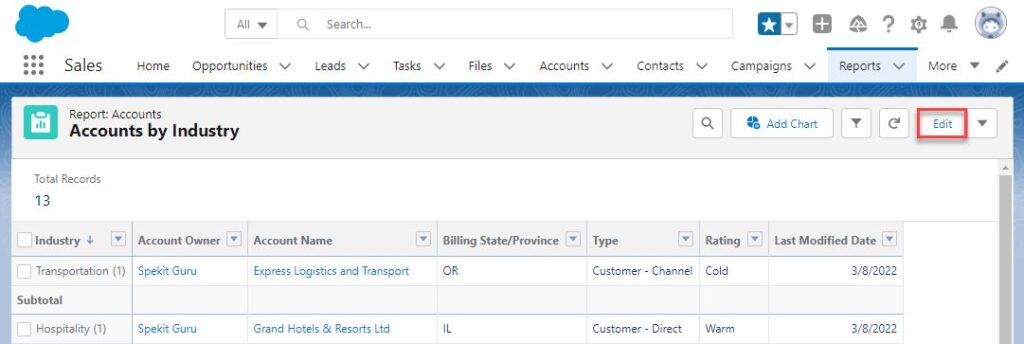
3. How to Edit a Report in Salesforce Lightning
1. Navigate to the Report you want to edit.
2. Click Edit.

3. Make the needed edits.
Outline Tab
- Groups
- Groupings of up to 3 fields if no Group Columns; otherwise max of 2 Group Rows and 2 Group Columns.
- Use the search bar to find fields by name.
- Group Rows
- Add fields as groups to create a summary report.
- Group Columns
- Add Column groupings to create a matrix report.
Columns
- Drag and drop to rearrange fields.
- Click the X to remove a field.
- Use the search bar to find fields by name.
- Filter Tab
- Search 🔍 for “Report Filters” to learn more about enhancing reporting capabilities.
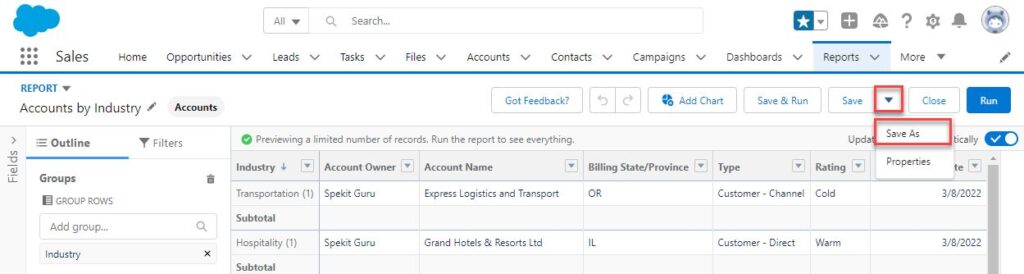
4. You have 2 options:
Save – Overwrite the existing report with the changes you made.
- Click Save.
Save As – Keep the existing report as is and create a report with these edits as new.
- Click the Down Arrow next to Save.
- Click Save As.
5. Enter a Report Name.
6. Click Select Folder and choose what folder the report should be saved to.
7. Click Save.
8. Toggles
- Row Counts
- Subtotals
- Grand Total

4. Report Best Practices in Salesforce Lightning
- Search: Before creating a new report, search first!
- Use Filters:
- Prevent Missing Results: Set Standard Filters to “All Records” for “All Time”
- Reuse Reports: Use relative date filters
- Cross-Filters: Use this instead of creating various Report Types
- Naming conventions: Make it easy to find your report again by keeping your report naming simple
- Organization: Save reports to the appropriate folder
- Auto-calculate: Utilize Groupings to enable Sum, Average, Max, Min of numbers/currency
- Pro Tip ✅ : If you need a new report but there are only a minor changes from an existing one, make the edits and then click Save As to save it as a new report!
5. Report Chart Types in Salesforce Lightning
When creating or editing a Chart you have 8 chart options to choose from.
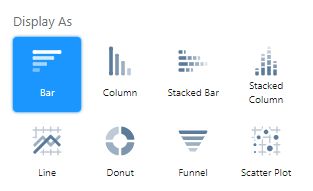
1. Bar
- You need at least one Grouping on the Report.

2. Column
- You need at least one Grouping on the Report.

3. Stacked Bar
- You need at least two Groupings on the Report.
- Choose to stack to 100% instead of by value.

4. Stacked Column
- You need at least two Groupings on the Report.
- Choose to stack to 100% instead of by value.

5. Line
- Display data over time.
- Display cumulative totals.

6. Donut
- A pie chart with a hole in the center for the value total of all wedges.
- Display value and/or percent.
- Combine Small Groups of wedges into an “Other” wedge.

7. Funnel
- Use to group a linear process like Opportunity Stage.
- Display value and/or percent.
- Combine Small Groups into an “Other” part of the Funnel.

8. Scatter Plot
- One or two Groupings and their measured values.

6. Report Charts in Salesforce Lightning
Charts can be added to reports to see a summary of results at a glance:
1. Navigate to a Report.
2. Click Edit.
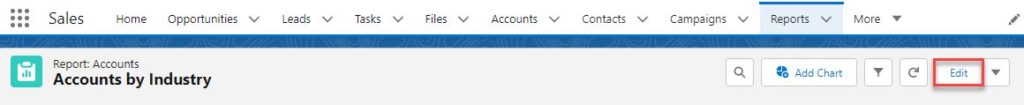
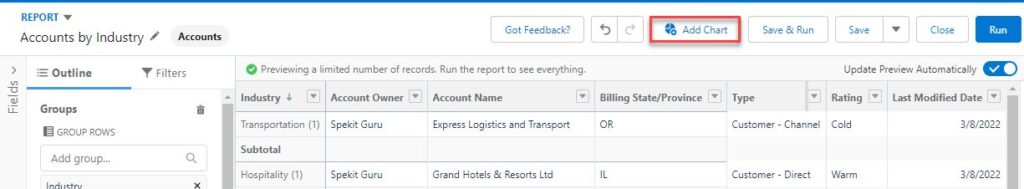
3. Click Add Chart.
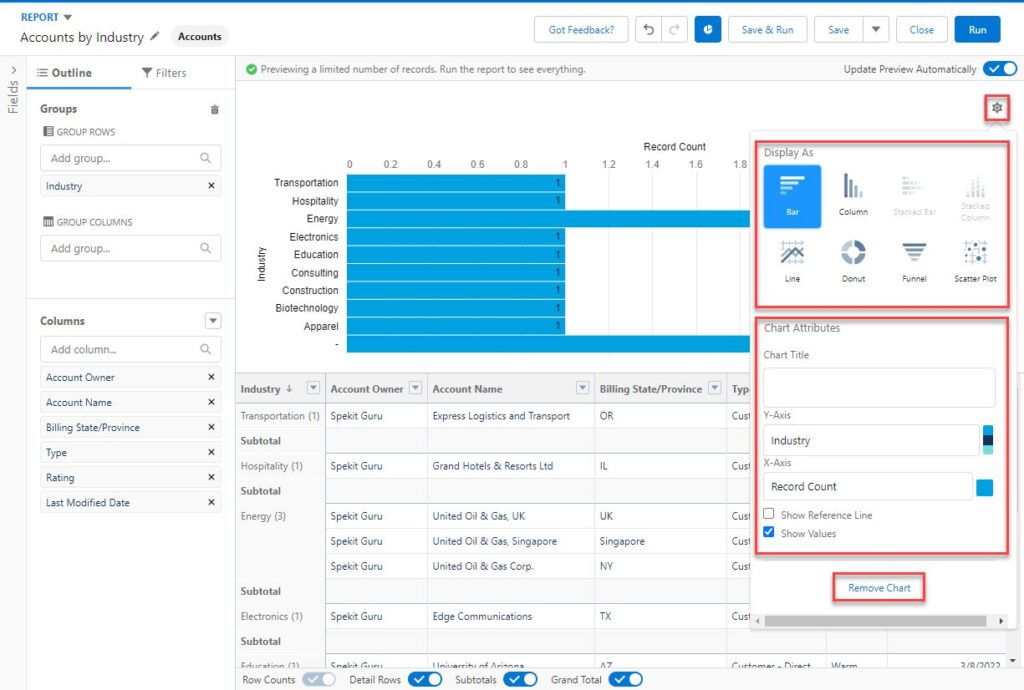
4. Click Chart Properties.
5. Choose a Chart Type.
- Search 🔍 for “Report Chart Types” to learn more.
6. Configure the Chart.
- These options will change depending on the Chart Type you choose.
- Making configuration changes will update the Preview in real-time.
- Click Remove Chart to do just that.
7. Click Chart Properties to close out of the configurator.
7. Report Filters in Salesforce Lightning
You can add filters to a Report to see records that match certain criteria instead of all records for that Object.
1. Navigate to a Report.
2. Click Edit.
3. Click the Filters tab.
4. Toggle on Update Preview Automatically to see the changes you are making apply to the report in real time.
5. Update Standard Filters.
5a. Show Me
- My records - Will show the records where you are the listed Record Owner.
- My team’s records - Will show the records where you are the Role above the Record Owners & Dependent on the Salesforce Role Hierarchy.
- All records - Will show all records.
5b. Date Filter
- Date
- Choose the date field to filter by.
- Range
- All Time
- Custom
- Dynamic, out-of-the-box range.
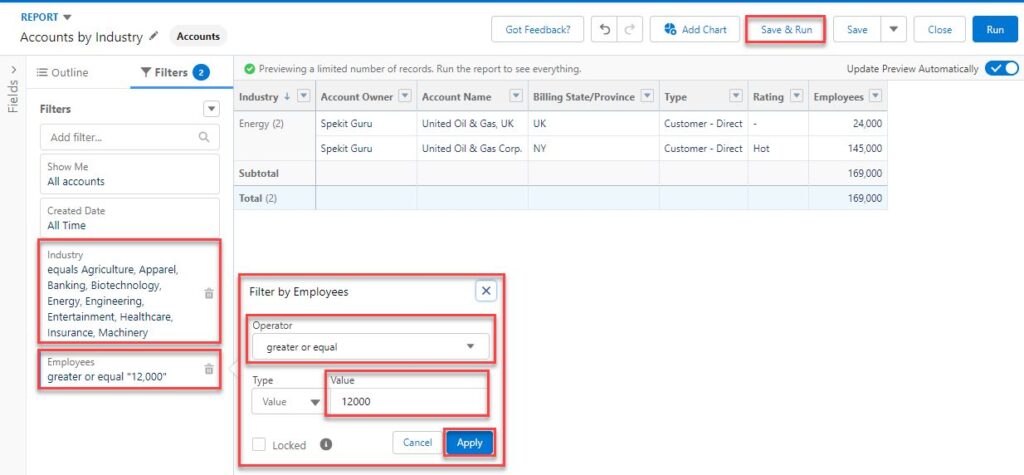
6. Add Custom Filters.
6a. Select the Field.
6b. Select the Operator.
6c. Enter the Value.
6d. Click Apply.
7. Click Save & Run.
Add Filter Logic
Filter Logic allows you to be more specific in drilling down your results.
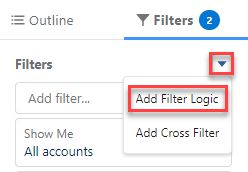
1. Click the Down Arrow next to “Filters”
2. Click Add Filter Logic.
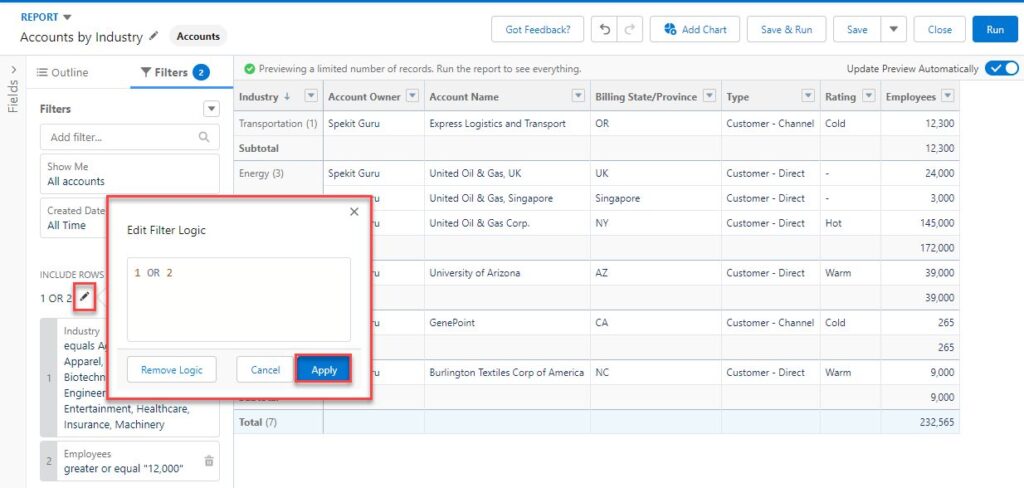
3. By default, Filter Logic is only ANDs, meaning all filters need to be true for the record to appear.
4. You can change it to be 1 OR 2 so that if either result is true for the record it will appear.
5. If you have even more filters you can add more detailed logic including parenthesis.
- i.e. (1 OR 2) AND 3
6. Click Apply.
8. Report Folders in Salesforce Lightning
Report Folders allow you to organize your Reports into different categories.
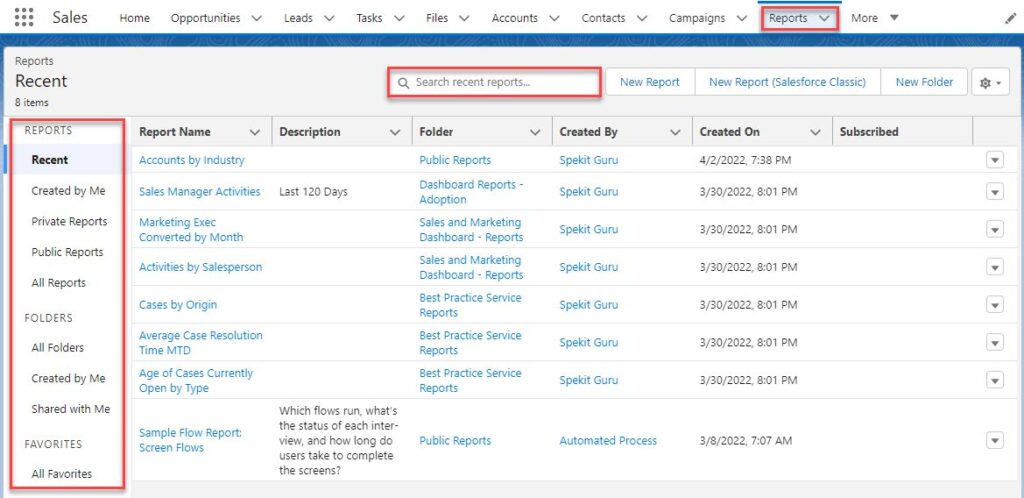
The Reports tab defaults to the Recent Reports list.
You can search 🔍 for existing Reports using the search bar at the top
- Searching for reports will help save time since you won’t need to create one from scratch
- Search for a keyword to narrow your results
- For example, “industry” if you are looking for Accounts by Industry
9. Report Properties in Salesforce Lightning
To change underlying Report Settings:
1. Navigate to a Report.
2. Click Edit.
3. Click the Down Arrow next to Save.
4. Click Properties.
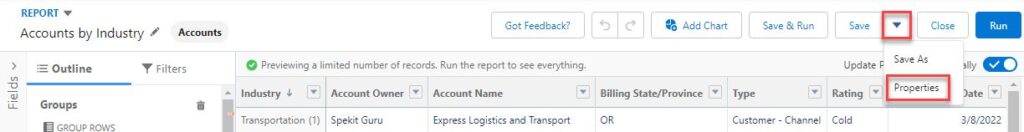
5. Make edits:
- Name
- Description
- Folder
6. Click Save.
10. Report Types in Salesforce Lightning
The Report Type you choose controls what fields you can add and filter with on your report
Report Type names are made up of Object names
- Search 🔍 for “Objects” to learn more
Finding a Report Type:
- Choose a category on the left
- Search 🔍 for the name in the search bar
- Scroll down
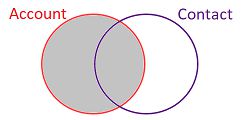
Report Types can be made up of 1 or more Objects. If made up of 2 or more objects they can have varying relationships such as
- Object with at least one related Object
- i.e. Accounts with Contacts
- The report will only return records that fit the filter criteria for Accounts that have at least 1 Contact record.
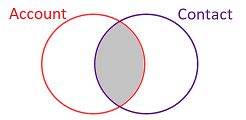
- Object with or without a related Object
- i.e. Accounts with or without Contacts
- The report will return records that fit the filter criteria for all Accounts, whether they have related Contacts or not.
11. Reports in Salesforce Lightning
Reports are collections of records to gain analytical details
- Help you slice and dice the data in different ways to compare in just a handful of clicks and drag-and-drops
- See trends over time
- Quickly see counts, averages, subtotals, totals, and more
Report Examples:
- Cases Opened Each Month
- Minimum, Maximum, and Average Time to Close a Case
- In Minutes, Hours, Days
- Opportunity Win Rate
- Opportunity Forecast
- Accounts Per Rep
- Calls Made Per Rep Per Account